
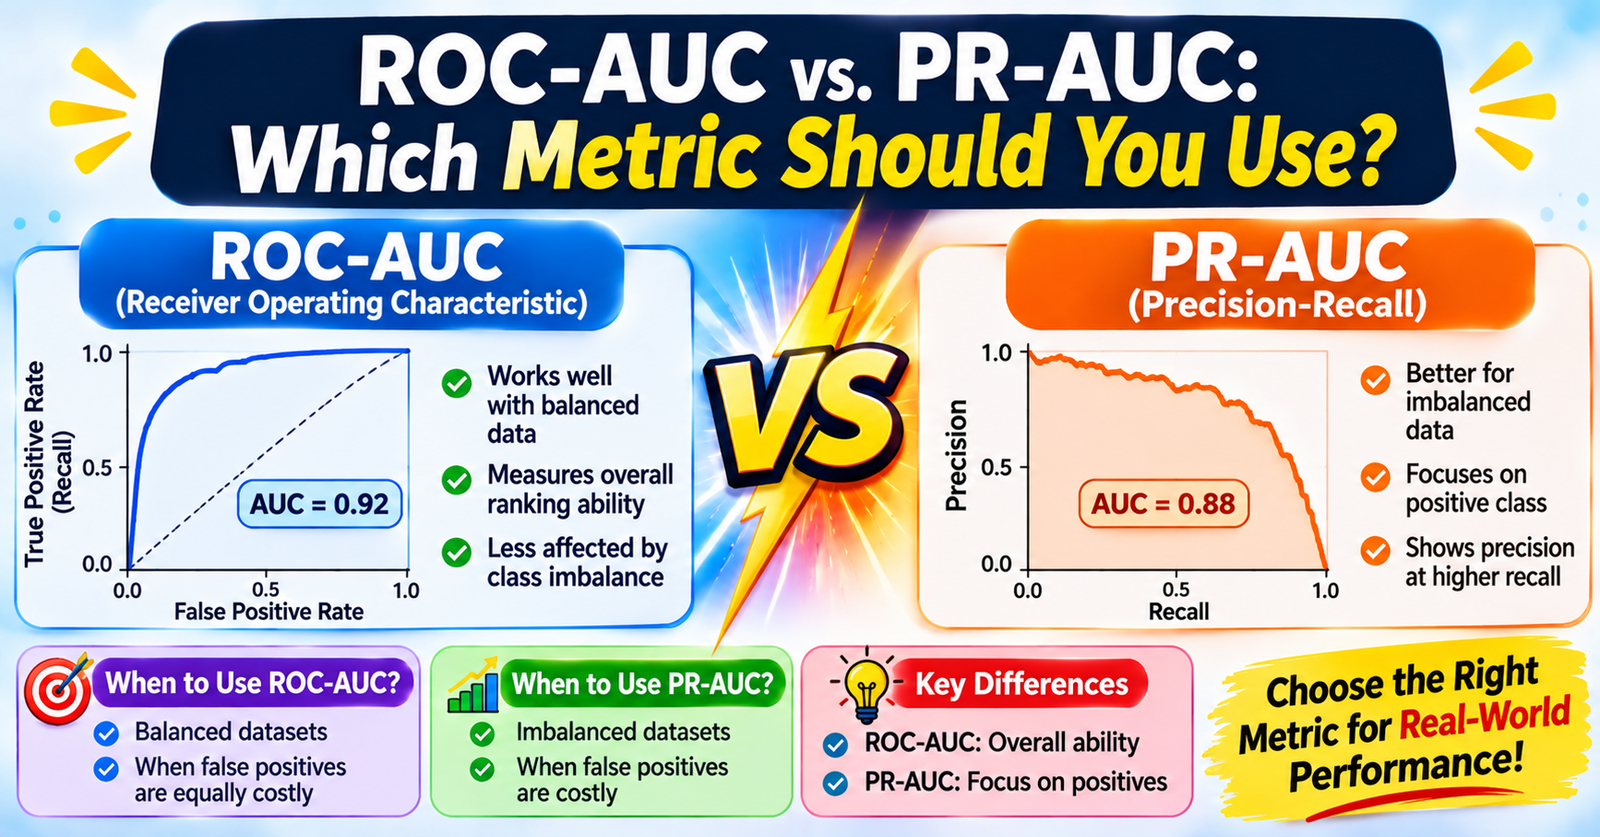
When evaluating binary classification models across all possible decision thresholds, data scientists typically rely on threshold-agnostic curves rather than picking a single arbitrary cutoff like 0.5.
The two standard industry curves are ROC-AUC (Receiver Operating Characteristic - Area Under Curve) and PR-AUC (Precision-Recall - Area Under Curve). While ROC-AUC is the ubiquitous default in machine learning tutorials, relying on it for the wrong problem can give you an overly optimistic, dangerously misleading assessment of model quality.
Understanding how both curves handle positive and negative distributions is critical for building trustworthy classification systems.
1. Deconstructing the Curves
Both metrics evaluate how effectively an algorithm ranks positive instances above negative instances across every potential decision threshold from 0.0 to 1.0. However, they plot fundamentally different axes from the confusion matrix.
| Metric Curve | Y-Axis | X-Axis | Primary Focus |
|---|---|---|---|
| ROC Curve | True Positive Rate (TPR) / Recall<br>$\frac{\text{TP}}{\text{TP} + \text{FN}}$ | False Positive Rate (FPR)<br>$\frac{\text{FP}}{\text{FP} + \text{TN}}$ | Tradeoff between detecting hits and ringing false alarms across all negatives |
| PR Curve | Precision<br>$\frac{\text{TP}}{\text{TP} + \text{FP}}$ | Recall (TPR)<br>$\frac{\text{TP}}{\text{TP} + \text{FN}}$ | Tradeoff between predictive reliability and coverage of the positive class |
2. What Is ROC-AUC?
The ROC Curve plots the True Positive Rate against the False Positive Rate:
- TPR (Recall): Out of all actual positives, what fraction did we identify?
- FPR: Out of all actual negatives, what fraction did we wrongly flag as positive?
Key Properties:
- Baseline (Random Chance): A purely random model produces a diagonal line from $(0,0)$ to $(1,1)$ with an $\text{AUC} = 0.50$.
- Perfect Classifier: Approaches the top-left corner $(0,1)$ with an $\text{AUC} = 1.00$.
- Class Distribution Invariance: Because TPR relies strictly on positive instances ($\text{TP} + \text{FN}$) and FPR relies strictly on negative instances ($\text{FP} + \text{TN}$), the shape of the ROC curve remains statistically unchanged if the ratio of positives to negatives shifts.
3. What Is PR-AUC?
The Precision-Recall Curve plots Precision directly against Recall:
- Precision: When the model predicts positive, how often is it actually correct?
- Recall: How many of the real positives did the model catch?
Key Properties:
- Baseline (Random Chance): Unlike ROC-AUC, the baseline of a PR curve is not 0.50. It equals the positive class prevalence:
$$\text{Baseline}_{\text{PR}} = \frac{P}{P + N}$$
For example, in a dataset with 1% positive cases, a random classifier yields a horizontal baseline of $\text{PR-AUC} = 0.01$.
- Perfect Classifier: Approaches the top-right corner $(1,1)$ with an $\text{AUC} = 1.00$.
- Sensitivity to Imbalance: The denominator of Precision includes $\text{FP}$ alongside $\text{TP}$. If the negative class is massive, even a tiny percentage of false alarms will dramatically outnumber true positives, directly pulling down Precision and shrinking the PR-AUC score.
4. The Critical Trap: Why ROC-AUC Fools You on Imbalanced Data
Consider a fraud detection scenario with 100,000 transactions:
- Actual Positives (Fraud): 100 transactions (0.1%)
- Actual Negatives (Legitimate): 99,900 transactions (99.9%)
Suppose a model produces 80 True Positives (catching 80% of fraud), but generates 999 False Positives (flagging ~1% of innocent transactions as fraud):
- Calculate the ROC Metrics: - $\text{TPR} = \frac{80}{100} = \mathbf{0.80}$ (80%) - $\text{FPR} = \frac{999}{99,900} = \mathbf{0.01}$ (1%) - Result on ROC: An FPR of 0.01 and TPR of 0.80 sits near the ideal top-left corner. The ROC curve will look exceptional ($\text{AUC} > 0.95$).
- Calculate the Precision Metric: - $\text{Precision} = \frac{\text{TP}}{\text{TP} + \text{FP}} = \frac{80}{80 + 999} = \frac{80}{1,079} \approx \mathbf{0.074}$ (7.4%) - Result on PR Curve: Over 92% of the alerts sent to human investigators are false alarms. The PR curve collapses because Precision is under 8%.
The Takeaway: In severe class imbalance, the vast sea of True Negatives ($\text{TN}$) inflates the denominator of FPR ($\text{FP} + \text{TN}$), artificially masking thousands of false positives in ROC space. PR-AUC isolates the positive class and immediately exposes this failure.
5. Head-to-Head Comparison
| Feature | ROC-AUC | PR-AUC |
|---|---|---|
| Components | True Positive Rate & False Positive Rate | Precision & Recall |
| Includes True Negatives? | Yes ($\text{TN}$ in FPR denominator) | No (focuses solely on $\text{TP}, \text{FP}, \text{FN}$) |
| Random Baseline | Always fixed at 0.50 | Equal to positive prevalence ($\frac{P}{P+N}$) |
| Impact of Adding Negative Samples | Minimal (curve stays stable) | Significant (Precision drops, AUC shrinks) |
| Primary Use Case | Balanced classes or when True Negatives matter equally | Rare-event detection, severe class imbalance |
| Risk | Can be deceptively optimistic on skewed data | Can vary dramatically between datasets with different base rates |
6. Practical Decision Framework
To decide which curve to use for model selection and validation:
- Choose PR-AUC when: - The positive class is rare (fraud detection, ad click-through rate, rare disease diagnosis, system intrusion detection). - False Positives carry high business costs (wasting human analyst time, user churn from false alerts). - You care much more about getting the positive predictions right than about correctly identifying the abundant negative cases.
- Choose ROC-AUC when: - Classes are balanced or only mildly imbalanced (e.g., 60:40 or 70:30). - You need a baseline metric that is invariant to shifts in class prevalence over time. - Correctly classifying the negative class ($\text{TN}$) is just as valuable to the business as classifying the positive class ($\text{TP}$).